
Internet of Things (IoT) has been a hot buzzword for the last few years. Simply put, IoT is the concept of connecting objects to a network in order to transfer data without human-to-human or human-to-computer interaction. This simple, yet powerful concept has a wide range of applications in manufacturing, healthcare and home automation, just to name a few. IoT is an interdisciplinary field, which requires working with electronics and sensors to capture data from physical objects, computer networking for data transfer and IT skills for building meaningful applications.
In this blog post, I will introduce the building blocks for creating a simple IoT application. To do this, I will use an Arduino microcontroller with a photocell (light intensity sensor), a node.js server for capturing and transferring the data, and a cloud service called plotly to visualise the data. By the end of this tutorial, we will have a functioning IoT application that you can customise to other use-cases.
1. Use case definition and architecture
To keep things simple and focused, we will build a simple application that keeps measuring light intensities using a photocell and plots these values on a graph in real-time.
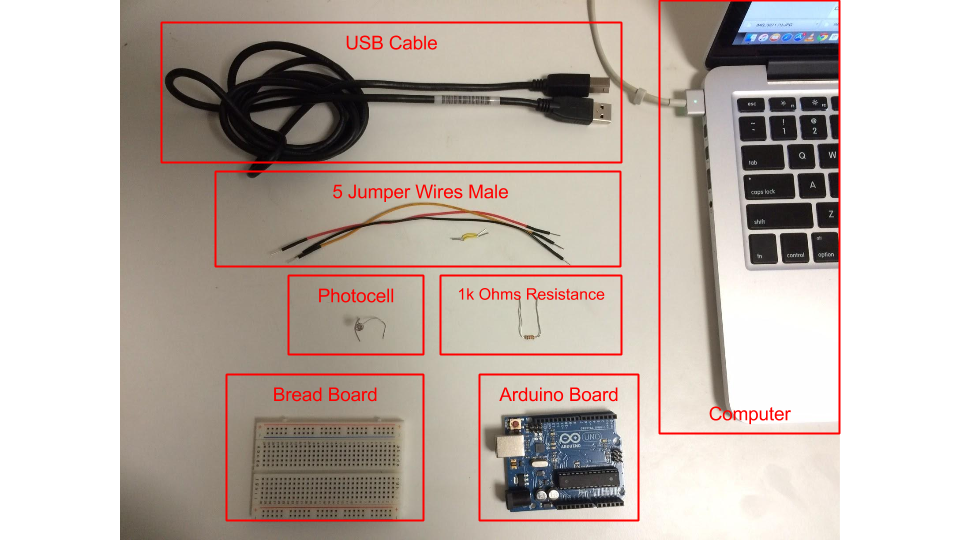
Required hardware:
- One Arduino microcontroller
- One photocell
- One 1k Ohms resistance
- One bread board
- Five jumper wires male
- One USB cable
- One computer (MAC or Windows) with internet connection
I recommend getting an Arduino Kit that contains an Arduino board with other electronic parts and components.
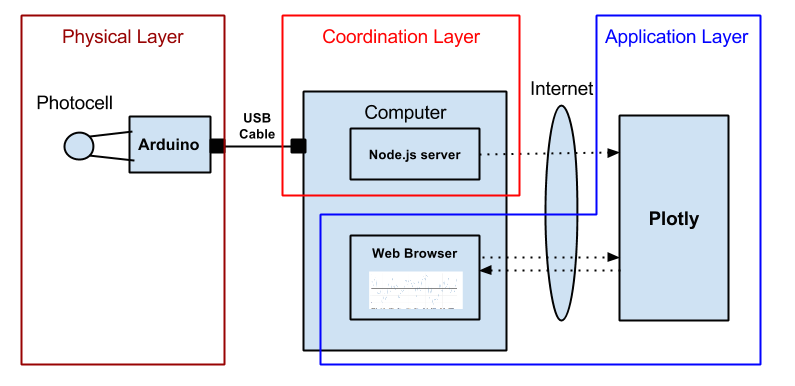
Architecture
To build this application, we need 3 main components:
- A physical layer for capturing light intensities. We will implement this using an Arduino micro controller and a photocell.
- A coordination layer used for capturing the measurements from the physical layer, and sending the measurements to our application. We will implement this using node.js.
- An application layer for visualizing the measurements in real-time. We will implement this using a data visualization cloud service called Plotly.
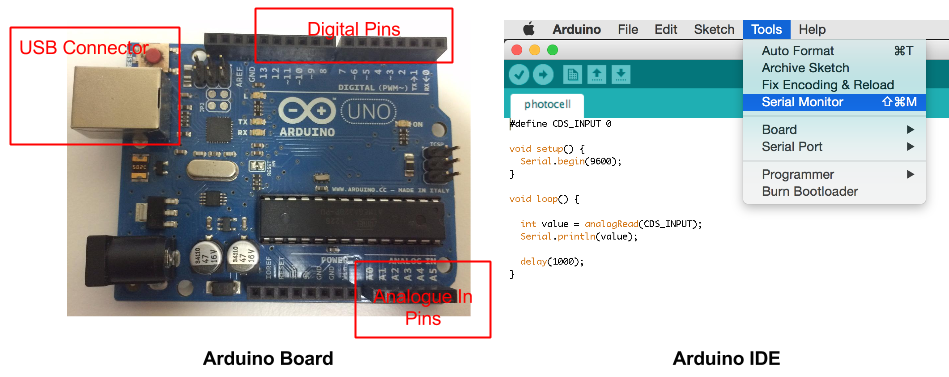
2. Microcontroller Programming 101 - A crash course in Arduino
Arduino is an open-source rapid electronic prototyping platform composed by the Arduino board (microcontroller) and the Arduino IDE (Integrated Development Environment) that runs on your computer. Arduino IDE is used to write and upload computer code to the physical board.
Arduino became very popular for electronic prototyping because of its very simple interface and low cost (under 30 USD for the board).
Getting Started with Arduino
To setup your Arduino, I recommend starting with the following guides. It should take you around 10 min for the basic setup.
Sensing light with Arduino and a photocell
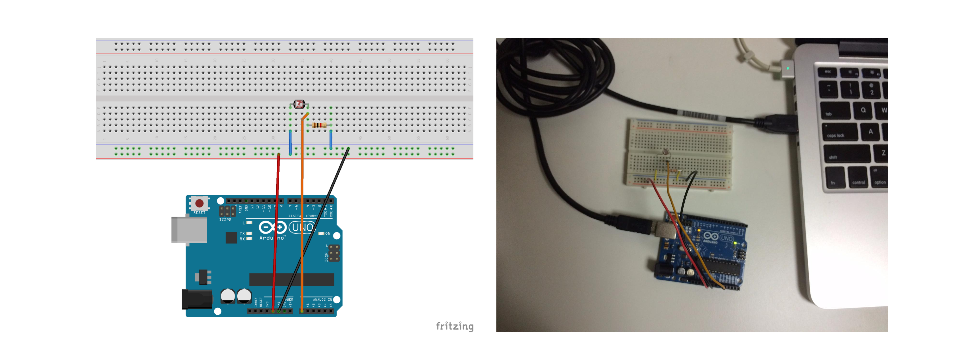
After setting up the Arduino board and the Arduino IDE, we can start building the physical layer for capturing light intensities.
Start by connecting the electronic components (One Photocell and one 1k Ohms resistance) to the Arduino board and the bread board as shown in the picture below. Once done, connect the Arduino board to the computer using a USB cable.
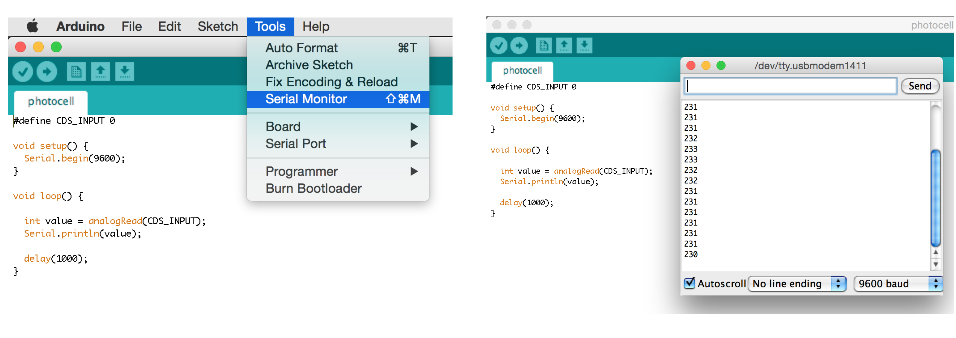
Next, open the IDE, copy the code below and upload the logic to the Arduino board. The code below implements a simple logic that configure the Arduino board to read the light intensity every second (1000 milliseconds) from the photocell (that is connected to the analogue input 0), and print the measurement to the serial monitor.
#define CDS_INPUT 0

void setup() {
  Serial.begin(9600);
}

void loop() {

  int value = analogRead(CDS_INPUT);
  Serial.println(value);

  delay(1000);
}
To see the measurements, open the serial monitor from the Arduino IDE.
3. Reading the measurements from Node.js
What is node.js?
Node.js is an open source, cross-platform runtime environment for server-side and networking applications. Node.js was originally designed as a tool for writing server programs, but it can do much more. It has a library management system called node package manager or npm that allows you to extend its functionality in many directions. To get started, download the node.js installer and install it on your machine.
Building Node.js server
In section 2, we used Arduino’s serial monitor to display the measurements. In this section, we will build a node.js server that gets light intensities from Arduino and displays these measurements on the terminal.
To build this server, we need one node library called serialport. from your terminal, execute npm install serialport to install the library.
Next, create a file called server1.js and copy into it the code below. Make sure to put the correct port name in line 2. You can get this value from Arduino IDE > Tools > Serial Port.
var serialport = require('serialport');
var portName = '/dev/tty.usbmodem1411';
var sp = new serialport.SerialPort(portName, {
    baudRate: 9600,
    dataBits: 8,
    parity: 'none',
    stopBits: 1,
    flowControl: false,
    parser: serialport.parsers.readline("\r\n")
});

sp.on('data', function(input) {
    console.log(input);
});
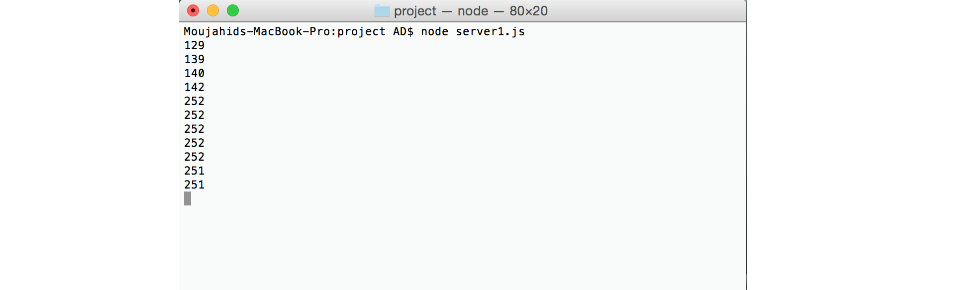
To start the node.js server, from you terminal go to the folder where server1.js is saved, and execute node server1.js. You will see the measurements displayed on the terminal.
4. Sending data to Plotly
What is Plotly?
Plotly is an online analytics and data visualization tool. Plotly has a Streaming API, which makes it perfect for our use case.
Plotly account and API keys
Create a free Plotly account by going to this url.
After creating your account, go to your setting and get 3 pieces of information.
- Username
- API key
- Streaming API token
Install Plotly library for node.js
In this section, we will build a node.js server that will get the measurements from Arduino and send the data to Plotly. To do this, we need to install Plotly library for node.js by executing npm install plotly from the terminal.
Connecting Node.js to Plotly
Create a file called server2.js and copy into it the code below. Make sure to put the correct plotly username name, API key and token in lines 2-3; and the correct Arduino port name in line 5.
var serialport = require('serialport'),
    plotly = require('plotly')('Plotly_UserName','Plotly_API'),
    token = 'Plotly_Token';

var portName = '/dev/tty.usbmodem1411';
var sp = new serialport.SerialPort(portName,{
    baudRate: 9600,
    dataBits: 8,
    parity: 'none',
    stopBits: 1,
    flowControl: false,
    parser: serialport.parsers.readline("\r\n")
});

// helper function to get a nicely formatted date string
function getDateString() {
    var time = new Date().getTime();
    // 32400000 is (GMT+9 Japan)
    // for your timezone just multiply +/-GMT by 36000000
    var datestr = new Date(time +32400000).toISOString().replace(/T/, ' ').replace(/Z/, '');
    return datestr;
}

var initdata = [{x:[], y:[], stream:{token:token, maxpoints: 500}}];
var initlayout = {fileopt : "extend", filename : "sensor-test"};

plotly.plot(initdata, initlayout, function (err, msg) {
    if (err) return console.log(err)

    console.log(msg);
    var stream = plotly.stream(token, function (err, res) {
        console.log(err, res);
    });

    sp.on('data', function(input) {
        if(isNaN(input) || input > 1023) return;

    var streamObject = JSON.stringify({ x : getDateString(), y : input });
    console.log(streamObject);
    stream.write(streamObject+'\n');
    });
});
To start the node.js server, from you terminal go to the folder where server2.js is saved, and execute node server2.js.
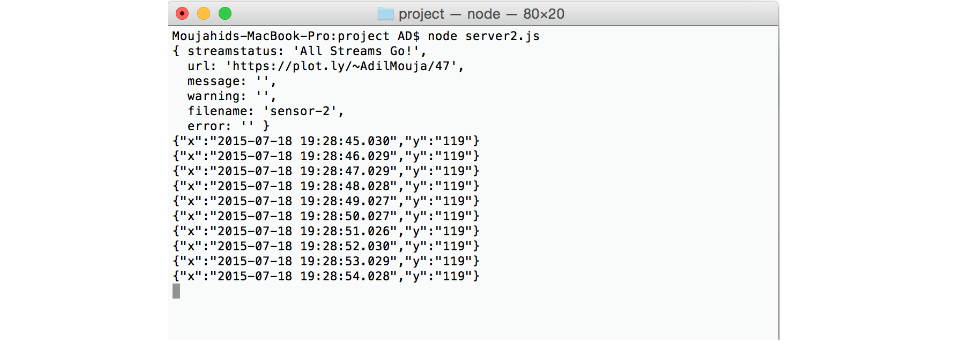
Viewing light intensities from Plotly
When you run server2.js code, it creates a file in Plotly called sensor-test. From Plotly website, click on sensor-test and you will be able to see a real-time graph that shows light intensities.
5. Conclusion
In this tutorial, we learned how to build an end-to-end IoT application covering:
- Getting measurements from an analogue input
- Processing the data using node.js
- Visualising the data using a 3rd party service
The techniques introduced in this tutorial can be leveraged to other IoT use cases. Below are a few ideas that you can try to improve on this solution.
- Wireless communication between Arduino and Node.js. This can be done using an Arduino Xbee shield.
- Saving the data to a database server. This can be done by customising the node.js code to push the data to a database, for example mongodb.
- Adding additional input to the application, for example a temperature sensor.
comments powered by Disqus