
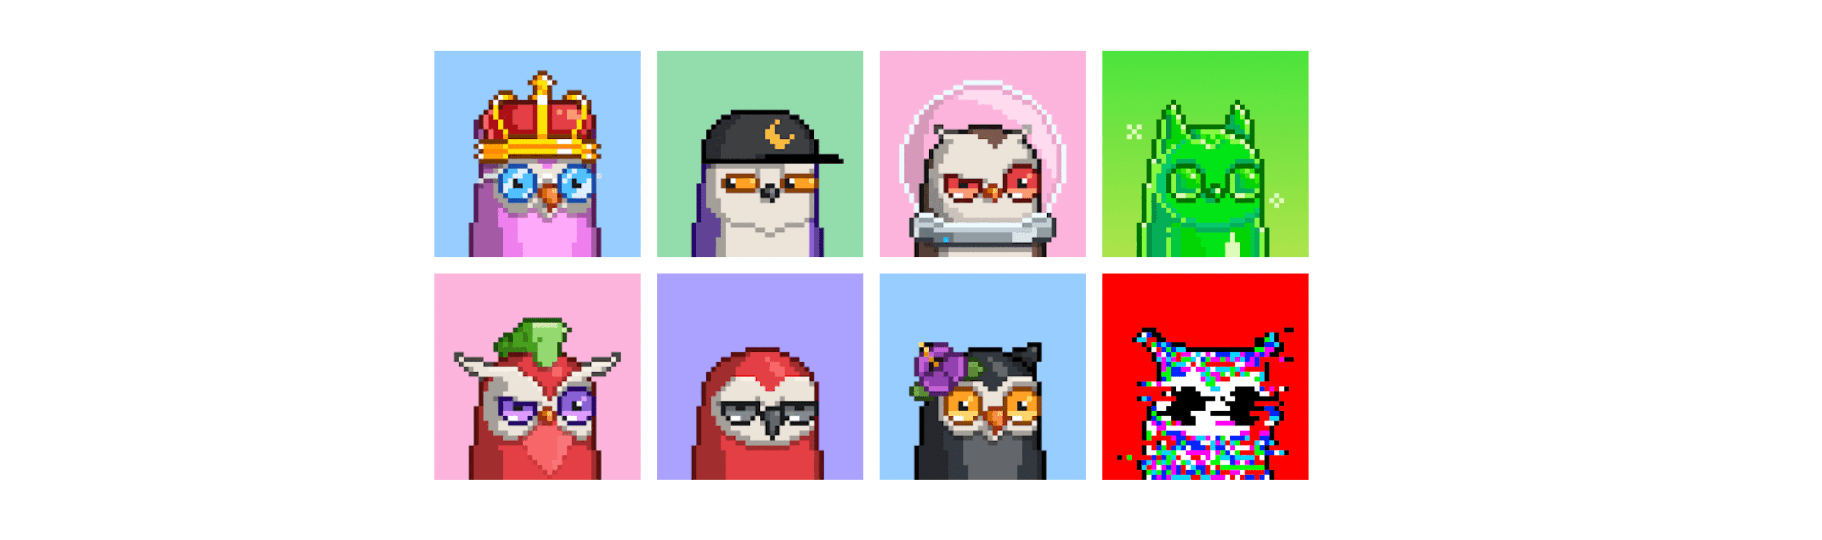
Moonbirds is the official PFP NFT project of the Proof collective. It consists of 10,000 utility-enabled PFPs that unlock different benefits depending on the traits and the locking period of the Moonbird NFT.
The project went live on April 16th, 2022. 2,000 Moobirds were reserved for the Proof Collective Pass holders, 125 were reserved for the Moonbirds company wallet, and the remaining 7,875 were sold at 2.5 ETH to the winners of a raffle organized by Proof. Since its launch, the project has had immense success, breaking record after record, and surpassing major NFT projects in total secondary sales volume and floor price. The project is ranked 9th in total secondary sales volume after one week of trading, and at the time of writing, the most expensive Moonbird sold for 1 Million USD, and the floor is above 100K USD.
In this blog post, we will use Python and Alchemy to do a deep dive analysis of the collection in its first week of trading. In section 1, we will cover how to download Moonbirds data using Python and Alchemy. In Section 2, we will do a deep dive analysis to understand better the sales trends, the price movements and the holders of Moonbirds.
The techniques from this tutorial can be used to analyze other NFT projects. You can find the source code and the data in this github repository.
1. Moonbirds Data Collection and Structuring
There are various marketplaces for buying and selling Moonbirds and other NFTs. The most popular one is opensea.io. OpenSea also provides APIs that can be used to download NFT transactions and other types of data in a structured format. In a previous post, I showed how to use python and opensea API to collect and analyze NFT data. Since then, Opensea made multiple modifications to the API and it requires now an API key to download the data. In addition, there have been new marketplaces like Looksrare that are growing in popularity and we want to take into account their transactions in our analysis.
The good news is all NFT data is recorded in the blockchain and we can pull this data directly from the source. To do this, we will be using:
- Alchemy: A blockchain developer platform that provides a suite of developer tools to interact with Ethereum and other blockchains.
- A16Z NFT Analyst Starter Pack: A set of Python scripts that make it easy to pull and structure NFT data.
For the tutorial, we will be using Python and I recommend Anaconda to create a Python virtual environment for the analysis. I already collected and structured the data of the first week of trading. If you’re only interested in the analysis, skip to chapter 2. If you want to understand how to get and structure the data, check the next section.
1.1. Getting Data
Once you create and activate your Python virtual environment, from a terminal, clone the A16Z NFT Analyst Starter Pack and install its dependencies by executing the following commands.
git clone git@github.com:a16z/nft-analyst-starter-pack.git
cd nft-analyst-starter-pack
pip3 install -r requirements.txt
Next, sign up for a free Alchemy account at alchemy.com and get your Alchemy API key.
Next, we need to get the contract address of Moonbirds. We can get it by going to the official Opensea page of Moonbirds and clicking on the Etherscan logo. The contract address is 0x23581767a106ae21c074b2276d25e5c3e136a68b.

Next from a terminal, enter the A16Z NFT Analyst Starter Pack folder and execute the following command. Make sure to change "YourAPIKey" to your Alchemy API key.
python export_data.py --alchemy-api-key YourAPIKey --contract-address 0x23581767a106ae21c074b2276D25e5C3e136a68b
The command will take a couple of minutes to finish executing and outputting the data as three CSV files.
- sales_0x7Bd29408f11D2bFC23c34f18275bBf23bB716Bc7.csv
- transfers_0x7Bd29408f11D2bFC23c34f18275bBf23bB716Bc7.csv
- metadata_0x7Bd29408f11D2bFC23c34f18275bBf23bB716Bc7.csv
1.2. Augmenting and Structuring the Data
The sales and transfers CSV files contain the date of the transactions but not the time. Since we’re making the analysis using only one week's worth of data, it’s preferable to add the time of the transactions to have a more granular view of the data. To do this, we will using the web3 python library with the Alchemy API to get the timestamps of the transactions.
In [1]:
from datetime import datetime, date, timedelta
from web3 import Web3
import pandas as pd
In [2]:
sales = pd.read_csv('./data/sales_0x23581767a106ae21c074b2276D25e5C3e136a68b.csv')
transfers = pd.read_csv('./data/transfers_0x23581767a106ae21c074b2276D25e5C3e136a68b.csv')
In [6]:
ALCHEMY_KEY = "YOUR_ALCHEMY_API_KEY"
w3 = Web3(Web3.HTTPProvider("https://eth-mainnet.alchemyapi.io/v2/"+ALCHEMY_KEY))
In [7]:
def get_timestamp(block_id):
    return w3.eth.getBlock(block_id)['timestamp']

sales['timestamp'] = sales['block_number'].apply(lambda x: get_timestamp(x))
Also, we don’t have an easy way to check who’s the owner of a Moonbird at a specific date. To solve this, we’ll create a DataFrame that has Moonbird asset_ids as index, the dates as columns, and the addresses of the owners at the end of each trading day as values.
In [9]:
def get_owners_daily(transfers):

    transfers['date'] = pd.to_datetime(transfers['date'])

    owners_dict = {}

    #Get first and last dates in transfers DF
    first_date = transfers['date'].min()
    last_date = transfers['date'].max()

    #Getting owners at the end of the first date
    this_data = transfers[transfers['date'] == first_date]
    asset_ids = pd.Series(name='asset_id', data=range(10000))
    this_data = this_data.merge(asset_ids, how='right', on='asset_id')
    owners = list(this_data.drop_duplicates(['asset_id'], keep='first')['to_address'])
    #print(owners)
    owners_dict[first_date] = owners.copy()

    this_date = first_date + timedelta(days=1)
    transfered_asset_ids = this_data['asset_id'].unique()
    while(this_date <= last_date):
        this_data = transfers[transfers['date'] == this_date]
        transfered_asset_ids = this_data['asset_id'].unique()
        for transfered_asset_id in transfered_asset_ids:
            owners[transfered_asset_id] = this_data[this_data['asset_id'] == transfered_asset_id].iloc[0]['to_address']
        owners_dict[this_date] = owners.copy()

        this_date += timedelta(days=1)

    return pd.DataFrame(owners_dict)
In [10]:
owners_daily = get_owners_daily(transfers)
Finally, we save the data into CSV files.
In [12]:
sales.to_csv('./data/sales.csv', index=False)
transfers.to_csv('./data/transfers.csv', index=False)
owners_daily.to_csv('./data/owners_daily.csv', index=False)
I also prepared 2 CSV files that contain the holders of the following NFT projects on the date of minting (April 16th) and on the date of writing this blog post (April 23rd).
- Proof Collective
- Bored Ape Yacht Club (BAYC)
- Mutant Ape Yacht Club (MAYC)
- Bored Ape Kennel Club (BAKC)
- Meebits
- Doodles
- Cool Cats
- Azuki
- CLONE X
- World of Women
We will be using this data to check the intersection between Moonbirds owners and those NFT projects. I skipped Cryptopunks as it was challenging to get the owners list.
2. Analyzing the Data
Now that we have the data in a structured format, we can work on our analysis. You can find the data we will be using in this github repository. We start by reading importing the libraries that we need:
In [1]:
%matplotlib inline
In [2]:
import warnings
warnings.filterwarnings('ignore')
In [3]:
from itertools import chain
from datetime import datetime, date, timedelta
import pandas as pd
In [4]:
import matplotlib
import matplotlib.lines as mlines
import matplotlib.pyplot as plt
In [5]:
plt.style.use('ggplot')
Next, we read the 3 data files that we need for the analysis.
In [6]:
## Reading the data
sales = pd.read_csv('./data/sales.csv')
metadata = pd.read_csv('./data/metadata.csv')
owners_daily = pd.read_csv('./data/owners_daily.csv')
In [7]:
#Parsing the dates
sales['date'] = pd.to_datetime(sales['date'])
sales['datetime'] = pd.to_datetime(sales['timestamp'], unit='s')
2.1. Sales and Prices Statistics
We start by analayzing Moonbirds' sales volume and prices. We will compute different statistics and plot a few graphs that shows the breakdown of the sales volume and the price evolution during the first week of trading.
In [8]:
start_date = sales['date'].min()
end_date = sales['date'].min()

start_date_str = str(start_date)[:10]
end_date_str = str(end_date)[:10]
In [9]:
def format_number(number, currency):

    suffixes = ['', 'K', 'M', 'B']

    if (number >= 10**9):
        return "{:,.0f}B {}".format(number/10**9, currency)
    elif (number >= 10**6):
        return "{:,.0f}M {}".format(number/10**6, currency)
    elif (number >= 10**3):
        return "{:,.0f}K {}".format(number/10**3, currency)
    else:
        return "{:,.2f} {}".format(number, currency)
Total Volume, Highest and Average Sale Prices
In [10]:
max_sale_eth = sales['sale_price_eth'].max()
mean_sale_eth = sales['sale_price_eth'].mean()
total_sales_eth = sales['sale_price_eth'].sum()

max_sale_usd = sales['sale_price_usd'].max()
mean_sale_usd = sales['sale_price_usd'].mean()
total_sales_usd = sales['sale_price_usd'].sum()

print("The highest Moonbird sale between %s and %s is %s (%s)."
      %(start_date_str, end_date_str, format_number(max_sale_eth, 'ETH'), format_number(max_sale_usd, 'USD')))

print("The average Moonbird sale between %s and %s is %s (%s)."
      %(start_date_str, end_date_str, format_number(mean_sale_eth, 'ETH'), format_number(mean_sale_usd, 'USD')))

print("The total volume of Moonbird sales between %s and %s is %s (%s)."
      %(start_date_str, end_date_str, format_number(total_sales_eth, 'ETH'), format_number(total_sales_usd, 'USD')))
The highest Moonbird sale between 2022-04-16 and 2022-04-16 is 350.00 ETH (1M USD).
The average Moonbird sale between 2022-04-16 and 2022-04-16 is 16.02 ETH (49K USD).
The total volume of Moonbird sales between 2022-04-16 and 2022-04-16 is 112K ETH (341M USD).
Total Volume, Highest and Average Sale Prices broken down by Date
In [11]:
dates = list(sales['date'].unique())
dates.reverse()
dates_currencies = []
for date in dates:
    for currency in [' ', ' ']:
        dates_currencies.append( (date, currency) )
index = pd.MultiIndex.from_tuples(dates_currencies, names=[" ", " "])

total_daily_sales_eth = sales.groupby('date').sum()['sale_price_eth'].apply(lambda x: format_number(x, 'ETH'))
total_daily_sales_usd = sales.groupby('date').sum()['sale_price_usd'].apply(lambda x: format_number(x, 'USD'))
total_daily_sales = [x for y in zip(list(total_daily_sales_eth),list(total_daily_sales_usd)) for x in y]
mean_daily_sales_eth = sales.groupby('date').mean()['sale_price_eth'].apply(lambda x: format_number(x, 'ETH'))
mean_daily_sales_usd = sales.groupby('date').mean()['sale_price_usd'].apply(lambda x: format_number(x, 'USD'))
mean_daily_sales = [x for y in zip(list(mean_daily_sales_eth),list(mean_daily_sales_usd)) for x in y]
max_daily_sales_eth = sales.groupby('date').max()['sale_price_eth'].apply(lambda x: format_number(x, 'ETH'))
max_daily_sales_usd = sales.groupby('date').max()['sale_price_usd'].apply(lambda x: format_number(x, 'USD'))
max_daily_sales = [x for y in zip(list(max_daily_sales_eth),list(max_daily_sales_usd)) for x in y]

df = pd.DataFrame({'Total Volume': total_daily_sales, 'Average Sale': mean_daily_sales, 'Highest Sale': max_daily_sales}, index=index)
df
Out[11]:
| Total Volume | Average Sale | Highest Sale | ||
|---|---|---|---|---|
| 2022-04-16 | 37K ETH | 10.08 ETH | 110.00 ETH | |
| 112M USD | 31K USD | 335K USD | ||
| 2022-04-17 | 24K ETH | 15.77 ETH | 135.00 ETH | |
| 73M USD | 48K USD | 414K USD | ||
| 2022-04-18 | 11K ETH | 22.12 ETH | 118.00 ETH | |
| 34M USD | 66K USD | 353K USD | ||
| 2022-04-19 | 6K ETH | 20.20 ETH | 83.00 ETH | |
| 19M USD | 62K USD | 254K USD | ||
| 2022-04-20 | 8K ETH | 24.89 ETH | 150.00 ETH | |
| 25M USD | 77K USD | 466K USD | ||
| 2022-04-21 | 13K ETH | 36.08 ETH | 175.00 ETH | |
| 39M USD | 111K USD | 539K USD | ||
| 2022-04-22 | 6K ETH | 36.80 ETH | 205.00 ETH | |
| 18M USD | 110K USD | 612K USD | ||
| 2022-04-23 | 7K ETH | 42.47 ETH | 350.00 ETH | |
| 20M USD | 126K USD | 1M USD |
Number of Moonbirds Sales per Day
In [61]:
data = sales.resample('D', on='datetime').count()['sale_price_eth']
ax = data.plot.bar(figsize=(18, 6))

ax.set_alpha(0.8)
ax.set_title("Number of Moobirds Sales per Day", fontsize=18)
ax.set_ylabel("Number of Moobirds Sales", fontsize=18)
Out[61]:
Text(0, 0.5, 'Number of Moobirds Sales')

Average Moonbird Price in ETH by day
In [120]:
data = sales.resample('D', on='datetime').mean()['sale_price_eth']
ax = data.plot(figsize=(18,6), color="green", linewidth=1, marker='o', markerfacecolor='grey', markeredgewidth=0)

ax.set_alpha(0.8)
ax.set_title("Average Moonbird Price in ETH per Day", fontsize=18)
ax.set_ylabel("Average Price in ETH", fontsize=18);

dates = list(data.index)
values = list(data.values)

for i, j in zip(dates, values):
    ax.annotate(s="{:.0f}".format(j), xy=(i, j+.2), rotation=45)

Zooming into the 2 first days of trading
In [54]:
data = sales[sales['date'] < datetime(2022, 4, 18)]
data = data.resample('H', on='datetime').count()['sale_price_eth']
ax = data.plot.bar(figsize=(18, 6))

ax.set_alpha(0.8)
ax.set_title("Number of Moobirds Sales per Hour", fontsize=18)
ax.set_ylabel("Number of Moobirds Sales", fontsize=18)
Out[54]:
Text(0, 0.5, 'Number of Moobirds Sales')

In [84]:
data = sales[sales['date'] < datetime(2022, 4, 18)]
data = data.resample('H', on='datetime').mean()['sale_price_eth']

ax = data.plot(figsize=(18,6), color="green", linewidth=1, marker='o', markerfacecolor='grey', markeredgewidth=0)

ax.set_alpha(0.8)
ax.set_title("Timeline of Average Moonbird Price in ETH", fontsize=18)
ax.set_ylabel("Average Price in ETH", fontsize=18)

dates = list(data.index)
values = list(data.values)

for i, j in zip(dates, values):
    ax.annotate(s="{:.0f}".format(j), xy=(i, j+.2), rotation=45)

2.2. Analyzing Moonbirds Traits and Rarity
Next, we analyze the relationship between Moonbirds' traits/rarity and their prices.
The metadata DataFrame contains the attributes and rarity scores of all Moonbirds. We start by getting the list of attributes and check the distribution of the Moonbirds by specific attributes.
In [63]:
metadata_cols = list(metadata.columns)
attributes = [col for col in metadata_cols if col.endswith('_attribute')]
print(attributes)
['Eyes_attribute', 'Headwear_attribute', 'Body_attribute', 'Feathers_attribute', 'Background_attribute', 'Beak_attribute', 'Outerwear_attribute', 'Eyewear_attribute']
In the example below, we're focusing on the feathers attribute, but we can do the same for all attributes.
In [64]:
metadata['Feathers_attribute'].value_counts()
Out[64]:
Red                    1842
Brown                  1437
Gray                   1225
Purple                 1122
Black                  1104
Blue                   1063
White                   885
Pink                    500
Green                   448
Metal                   150
Bone                    150
Legendary Bone           25
Legendary Crescent       14
Legendary Emperor         9
Legendary Professor       9
Legendary Sage            9
Legendary Guardian        4
Legendary Brave           4
Name: Feathers_attribute, dtype: int64
Next, we analyze the breakdown of Moonbirds sales by a specific attribute. To do do this, we will need to merge the sales DataFrame with the metadata DataFrame.
In [65]:
sales = sales.merge(metadata, how='left', on='asset_id')
In the example below, we're focusing on the feathers attribute, but we can do the same for all attributes.
In [66]:
feathers_attribute_sales = {}

feathers_attributes = list(metadata['Feathers_attribute'].unique())

for attribute in feathers_attributes:
    attribute_metadata = metadata[metadata['Feathers_attribute'] == attribute]
    attribute_sales = sales[sales['Feathers_attribute'] == attribute]
    n_moonbirds = len(attribute_metadata)
    n_sales = len(attribute_sales)
    max_sale = attribute_sales['sale_price_eth'].max()
    mean_sale = attribute_sales['sale_price_eth'].mean()

    feathers_attribute_sales[attribute] = {'#Moonbirds': n_moonbirds, '#Sales': n_sales,
                                             'Highest Sale': format_number(max_sale, 'ETH'),
                                           'Average Sale': format_number(mean_sale, 'ETH')}

pd.DataFrame.from_dict(feathers_attribute_sales, orient='index')
Out[66]:
| #Moonbirds | #Sales | Highest Sale | Average Sale | |
|---|---|---|---|---|
| Gray | 1225 | 794 | 50.00 ETH | 14.94 ETH |
| Red | 1842 | 1320 | 50.00 ETH | 14.92 ETH |
| Blue | 1063 | 715 | 79.69 ETH | 15.07 ETH |
| White | 885 | 588 | 54.50 ETH | 14.99 ETH |
| Purple | 1122 | 790 | 73.75 ETH | 15.00 ETH |
| Black | 1104 | 836 | 75.00 ETH | 15.63 ETH |
| Metal | 150 | 93 | 80.00 ETH | 27.14 ETH |
| Legendary Emperor | 9 | 7 | 150.00 ETH | 100.14 ETH |
| Brown | 1437 | 1025 | 50.00 ETH | 14.58 ETH |
| Pink | 500 | 332 | 76.66 ETH | 15.49 ETH |
| Bone | 150 | 123 | 199.00 ETH | 31.11 ETH |
| Green | 448 | 314 | 44.00 ETH | 14.63 ETH |
| Legendary Guardian | 4 | 1 | 169.00 ETH | 169.00 ETH |
| Legendary Bone | 25 | 20 | 90.00 ETH | 48.68 ETH |
| Legendary Professor | 9 | 6 | 175.00 ETH | 100.34 ETH |
| Legendary Crescent | 14 | 10 | 305.00 ETH | 110.00 ETH |
| Legendary Brave | 4 | 4 | 90.00 ETH | 72.50 ETH |
| Legendary Sage | 9 | 10 | 350.00 ETH | 103.65 ETH |
Next, we check the breakdown of Moonbirds sales by the number of attributes.
In [67]:
attribute_counts_sales = {}

attribute_counts = list(metadata['attribute_count'].unique())

for attribute in attribute_counts:
    attribute_metadata = metadata[metadata['attribute_count'] == attribute]
    attribute_sales = sales[sales['attribute_count'] == attribute]
    n_moonbirds = len(attribute_metadata)
    n_sales = len(attribute_sales)
    max_sale = attribute_sales['sale_price_eth'].max()
    mean_sale = attribute_sales['sale_price_eth'].mean()

    attribute_counts_sales[attribute] = {'#Moonbirds': n_moonbirds, '#Sales': n_sales,
                                             'Highest Sale': format_number(max_sale, 'ETH'),
                                           'Average Sale': format_number(mean_sale, 'ETH')}

pd.DataFrame.from_dict(attribute_counts_sales, orient='index')
Out[67]:
| #Moonbirds | #Sales | Highest Sale | Average Sale | |
|---|---|---|---|---|
| 6 | 6610 | 4505 | 299.00 ETH | 15.55 ETH |
| 5 | 2057 | 1632 | 205.00 ETH | 14.66 ETH |
| 7 | 1263 | 796 | 130.00 ETH | 18.28 ETH |
| 8 | 46 | 36 | 80.00 ETH | 35.54 ETH |
| 3 | 24 | 19 | 350.00 ETH | 114.34 ETH |
Next, we analyze the relationship between sales prices and rarity scores. To do this, we plot sales prices vs. rarity scores.
Plotting Sales Prices vs. Rarity Scores
In [86]:
dates = list(sales['date'].unique())
labels = [str(date)[:10] for date in dates]
labels.sort()
colors = ['yellow','green','blue','purple','magenta','red', 'pink','brown']

plt.figure(figsize=(18,6))
plt.scatter(sales['overall_rarity_score'], sales['sale_price_eth'],
            c=sales['date'], cmap=matplotlib.colors.ListedColormap(colors), alpha=0.5, s=5)

handles = []
for (i, label) in enumerate(labels):
    handle = mlines.Line2D([], [], color=colors[i], marker='o', linestyle='None',
                          markersize=10, label=label)
    handles.append(handle)
plt.legend(handles=handles)
plt.title('Sales Prices vs. Rarity Scores')
plt.xlabel("Rarity Score", fontsize=18)
plt.ylabel("Average Price in ETH", fontsize=18)
plt.show()

Zooming into Moonbirds sales that have rarity scores smaller than 500
In [87]:
dates = list(sales['date'].unique())
labels = [str(date)[:10] for date in dates]
labels.sort()
colors = ['yellow','green','blue','purple','magenta','red', 'pink','brown']


data = sales[sales['overall_rarity_score'] < 500]
plt.figure(figsize=(18,6))
plt.scatter(data['overall_rarity_score'], data['sale_price_eth'],
            c=data['date'], cmap=matplotlib.colors.ListedColormap(colors), alpha=0.5, s=5)

handles = []
for (i, label) in enumerate(labels):
    handle = mlines.Line2D([], [], color=colors[i], marker='o', linestyle='None',
                          markersize=10, label=label)
    handles.append(handle)
plt.legend(handles=handles)
plt.title('Sales Prices vs. Rarity Scores')
plt.xlabel("Rarity Score", fontsize=18)
plt.ylabel("Average Price in ETH", fontsize=18)
plt.show()

Zooming into Moonbirds that have rarity scores higher than 500
In [88]:
dates = list(sales['date'].unique())
labels = [str(date)[:10] for date in dates]
labels.sort()
colors = ['yellow','green','blue','purple','magenta','red', 'pink','brown']

data = sales[sales['overall_rarity_score'] >= 500]
plt.figure(figsize=(18,6))
plt.scatter(data['overall_rarity_score'], data['sale_price_eth'],
            c=data['date'], cmap=matplotlib.colors.ListedColormap(colors), alpha=1, s=10)

handles = []
for (i, label) in enumerate(labels):
    handle = mlines.Line2D([], [], color=colors[i], marker='o', linestyle='None',
                          markersize=10, label=label)
    handles.append(handle)
plt.legend(handles=handles)
plt.title('Sales Prices vs. Rarity Scores')
plt.xlabel("Rarity Score", fontsize=18)
plt.ylabel("Average Price in ETH", fontsize=18)
plt.show()

We can see that the prices are increasing and the daily variance of prices of rare Moonbirds is decreasing.
2.3. Holders Analysis
Next, we analyze the Moonbirds' holders. We start by checking the ratio of unique holders and we analyze the intersection between Moonbirds' owners and other major NFT projects.
- Proof Collective
- Bored Ape Yacht Club (BAYC)
- Mutant Ape Yacht Club (MAYC)
- Bored Ape Kennel Club (BAKC)
- Meebits
- Doodles
- Cool Cats
- Azuki
- CLONE X
- World of Women
Calculating ratio of unique holders
In [89]:
data_dict = {}

cols = list(owners_daily.columns)

for col in cols[1:]:
    n_assets = len(owners_daily[col].dropna())
    n_unique_holders = len(owners_daily[col].dropna().unique())
    data_dict[col] = float(n_unique_holders)/n_assets

data = pd.Series(index=data_dict.keys(), data=data_dict.values())

ax = data.plot(figsize=(18,6), color="green", linewidth=1, marker='o', markerfacecolor='grey', markeredgewidth=0)

ax.set_alpha(0.8)
ax.set_title("Unique Holders Ratio", fontsize=18)
ax.set_ylabel("Unique Holders Ratio", fontsize=18)
Out[89]:
Text(0, 0.5, 'Unique Holders Ratio')

We can see that the ratio is dropping from 70% to below 65%.
Top 10 Holders in the last day
In [74]:
owners_daily[cols[-1]].value_counts()[:10]
Out[74]:
0x7b557aa52d0055d84b1e3f5487d9018f318372c1    109
0x83c8f28c26bf6aaca652df1dbbe0e1b56f8baba2     44
0x713a24fa5a811cdc1e9be72e670e8d3a6a9b89af     39
0xfd845e07717b0329d3f19fc920c97fba0bc4ee31     33
0x9ec8e8f64ec6bb47d944b4b830130b5fcf2da182     32
0x5afcabcbfeed16ea120a9d3c7c52d0212dda8111     31
0x6b52e83941eb10f9c613c395a834457559a80114     26
0x6615b87546e64851f33515d23d70c50c3a7929ea     23
0xabf9ba3867f15928ee4d29a85c3777a11f09f43d     22
0xdd72d3ae8368be34431871ef254d5e07ffebab8c     20
Name: 2022-04-23, dtype: int64
Number of Addresses that hold 1 Moonbird
In [92]:
for col in cols:
    n_one_moonbirs_holders = (owners_daily[col].value_counts() == 1).sum()
    print("The number of addresses that hold 1 Moonbird on %s is: %s." %(col, n_one_moonbirs_holders) )
The number of addresses that hold 1 Moonbird on 2022-04-15 is: 1.
The number of addresses that hold 1 Moonbird on 2022-04-16 is: 5500.
The number of addresses that hold 1 Moonbird on 2022-04-17 is: 5132.
The number of addresses that hold 1 Moonbird on 2022-04-18 is: 5083.
The number of addresses that hold 1 Moonbird on 2022-04-19 is: 4996.
The number of addresses that hold 1 Moonbird on 2022-04-20 is: 4946.
The number of addresses that hold 1 Moonbird on 2022-04-21 is: 4908.
The number of addresses that hold 1 Moonbird on 2022-04-22 is: 4846.
The number of addresses that hold 1 Moonbird on 2022-04-23 is: 4838.
Intersection between moonbirds' holders and other major NFT projects
We start by reading 2 CSV files that contain the holders of the following NFT projects on the date of minting (April 16th) and on the date of writing this blog post (April 23rd).
- Proof Collective
- Bored Ape Yacht Club (BAYC)
- Mutant Ape Yacht Club (MAYC)
- Bored Ape Kennel Club (BAKC)
- Meebits
- Doodles
- Cool Cats
- Azuki
- CLONE X
- World of Women
In [93]:
owners_daily_20220416 = pd.read_csv('./data/owners_daily_20220416.csv')
owners_daily_20220423 = pd.read_csv('./data/owners_daily_20220423.csv')
In [117]:
minting_date_str = '2022-04-16'
writing_date_str = '2022-04-23'

intersection_dict = {}

for date_str in [minting_date_str, writing_date_str]:
    intersection_dict[date_str] = {}
    for col in owners_daily_20220416.columns:
        moonbirds_holders = list(owners_daily[date_str].dropna().unique())
        if date_str == minting_date_str:
            nft_holders = list(owners_daily_20220416[col].dropna().unique())
        else:
            nft_holders = list(owners_daily_20220423[col].dropna().unique())
        intersection_dict[date_str][col] = len(list(set(moonbirds_holders).intersection(nft_holders)))
In [119]:
pd.DataFrame(intersection_dict)
Out[119]:
| 2022-04-16 | 2022-04-23 | |
|---|---|---|
| Meebits | 268 | 373 |
| BAYC | 293 | 520 |
| MAYC | 516 | 828 |
| BAKC | 251 | 391 |
| Doodles | 310 | 454 |
| Cool Cats | 370 | 419 |
| Azuki | 363 | 535 |
| CLONE X | 392 | 557 |
| World of Women | 194 | 266 |
| Proof Collective | 844 | 848 |
We can see that the the holders of the NFT projects above added more Moonbirds to their wallets.
Conclusion
In this blog post, we did a deep dive analysis of the first trading week of Moonbirds. We analyzed the sales volume and price movements, we analyzed how the traits and rarity affect the price, and we analyzed the intersection between Moonbirds' owners and other major NFT projects. The analysis introduced here can be extended to other scenarios or other NFT collections.
comments powered by Disqus