
Text mining is the application of natural language processing techniques and analytical methods to text data in order to derive relevant information. Text mining is getting a lot attention these last years, due to an exponential increase in digital text data from web pages, google's projects such as google books and google ngram, and social media services such as Twitter. Twitter data constitutes a rich source that can be used for capturing information about any topic imaginable. This data can be used in different use cases such as finding trends related to a specific keyword, measuring brand sentiment, and gathering feedback about new products and services.
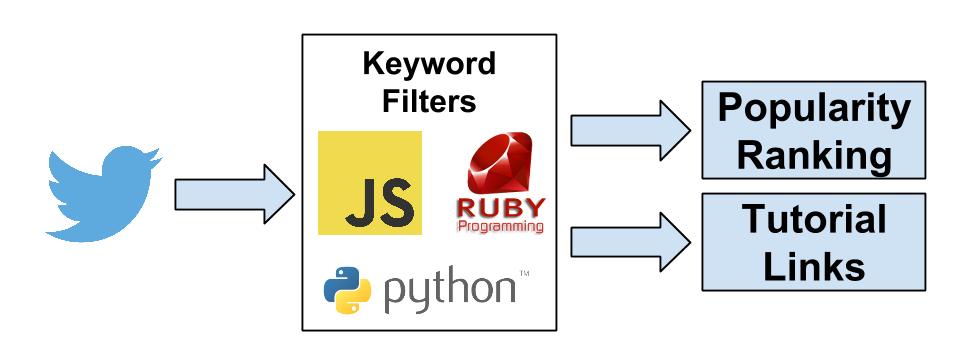
In this tutorial, I will use Twitter data to compare the popularity of 3 programming languages: Python, Javascript and Ruby, and to retrieve links to programming tutorials. In the first paragraph, I will explaing how to connect to Twitter Streaming API and how to get the data. In the second paragraph, I will explain how to structure the data for analysis, and in the last paragraph, I will explain how to filter the data and extract links from tweets.
Using only 2 days worth of Twitter data, I could retrieve 644 links to python tutorials, 413 to javascript tutorials and 136 to ruby tutorials. Furthermore, I could confirm that python is 1.5 times more popular than javascript and 4 times more popular than ruby.
1. Getting Data from Twitter Streaming API
API stands for Application Programming Interface. It is a tool that makes the interaction with computer programs and web services easy. Many web services provides APIs to developers to interact with their services and to access data in programmatic way. For this tutorial, we will use Twitter Streaming API to download tweets related to 3 keywords: "python", "javascript", and "ruby".
Step 1: Getting Twitter API keys
In order to access Twitter Streaming API, we need to get 4 pieces of information from Twitter: API key, API secret, Access token and Access token secret. Follow the steps below to get all 4 elements:
- Create a twitter account if you do not already have one.
- Go to https://apps.twitter.com/ and log in with your twitter credentials.
- Click "Create New App"
- Fill out the form, agree to the terms, and click "Create your Twitter application"
- In the next page, click on "API keys" tab, and copy your "API key" and "API secret".
- Scroll down and click "Create my access token", and copy your "Access token" and "Access token secret".
Step 2: Connecting to Twitter Streaming API and downloading data
We will be using a Python library called Tweepy to connect to Twitter Streaming API and downloading the data. If you don't have Tweepy installed in your machine, go to this link, and follow the installation instructions.
Next create, a file called twitter_streaming.py, and copy into it the code below. Make sure to enter your credentials into access_token, access_token_secret, consumer_key, and consumer_secret.
#Import the necessary methods from tweepy library
from tweepy.streaming import StreamListener
from tweepy import OAuthHandler
from tweepy import Stream

#Variables that contains the user credentials to access Twitter API
access_token = "ENTER YOUR ACCESS TOKEN"
access_token_secret = "ENTER YOUR ACCESS TOKEN SECRET"
consumer_key = "ENTER YOUR API KEY"
consumer_secret = "ENTER YOUR API SECRET"


#This is a basic listener that just prints received tweets to stdout.
class StdOutListener(StreamListener):

    def on_data(self, data):
        print data
        return True

    def on_error(self, status):
        print status


if __name__ == '__main__':

    #This handles Twitter authetification and the connection to Twitter Streaming API
    l = StdOutListener()
    auth = OAuthHandler(consumer_key, consumer_secret)
    auth.set_access_token(access_token, access_token_secret)
    stream = Stream(auth, l)

    #This line filter Twitter Streams to capture data by the keywords: 'python', 'javascript', 'ruby'
    stream.filter(track=['python', 'javascript', 'ruby'])
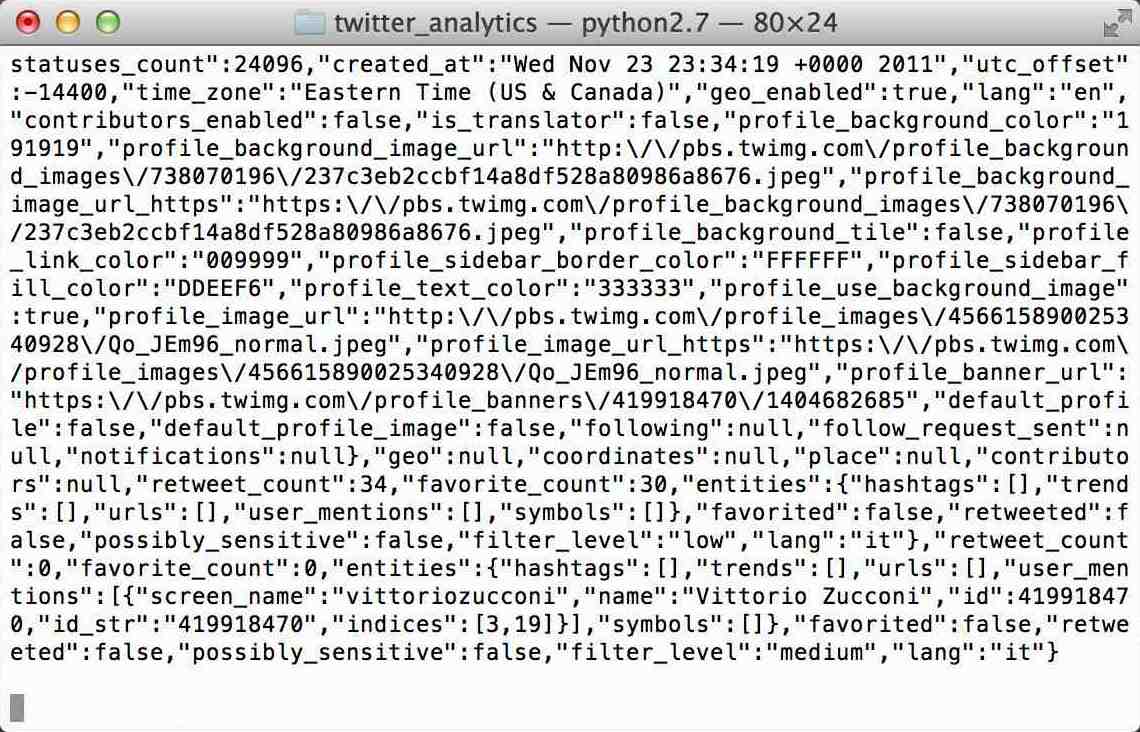
If you run the program from your terminal using the command: python twitter_streaming.py, you will see data flowing like the picture below.
You can stop the program by pressing Ctrl-C.
We want to capture this data into a file that we will use later for the analysis. You can do so by piping the output to a file using the following command: python twitter_streaming.py > twitter_data.txt.
I run the program for 2 days (from 2014/07/15 till 2014/07/17) to get a meaningful data sample. This file size is 242 MB.
2. Reading and Understanding the data
The data that we stored twitter_data.txt is in JSON format. JSON stands for JavaScript Object Notation. This format makes it easy to humans to read the data, and for machines to parse it. Below is an example for one tweet in JSON format. You can see that the tweet contains additional information in addition to the main text which in this example: "Yaayyy I learned some JavaScript today! #thatwasntsohard #yesitwas #stoptalkingtoyourself #hashbrown #hashtag".
{"created_at":"Tue Jul 15 14:19:30 +0000 2014","id":489051636304990208,"id_str":"489051636304990208","text":"Yaayyy I learned some JavaScript today! #thatwasntsohard #yesitwas #stoptalkingtoyourself #hashbrown #hashtag","source":"\u003ca href=\"http:\/\/twitter.com\/download\/iphone\" rel=\"nofollow\"\u003eTwitter for iPhone\u003c\/a\u003e","truncated":false,"in_reply_to_status_id":null,"in_reply_to_status_id_str":null,"in_reply_to_user_id":null,"in_reply_to_user_id_str":null,"in_reply_to_screen_name":null,"user":{"id":2301702187,"id_str":"2301702187","name":"Toni Barlettano","screen_name":"itsmetonib","location":"Greater NYC Area","url":"http:\/\/www.tonib.me","description":"So Full of Art | \nToni Barlettano Creative Media + Design","protected":false,"followers_count":8,"friends_count":25,"listed_count":0,"created_at":"Mon Jan 20 16:49:46 +0000 2014","favourites_count":6,"utc_offset":null,"time_zone":null,"geo_enabled":false,"verified":false,"statuses_count":20,"lang":"en","contributors_enabled":false,"is_translator":false,"is_translation_enabled":false,"profile_background_color":"C0DEED","profile_background_image_url":"http:\/\/abs.twimg.com\/images\/themes\/theme1\/bg.png","profile_background_image_url_https":"https:\/\/abs.twimg.com\/images\/themes\/theme1\/bg.png","profile_background_tile":false,"profile_image_url":"http:\/\/pbs.twimg.com\/profile_images\/425313048320958464\/Z2GcderW_normal.jpeg","profile_image_url_https":"https:\/\/pbs.twimg.com\/profile_images\/425313048320958464\/Z2GcderW_normal.jpeg","profile_link_color":"0084B4","profile_sidebar_border_color":"C0DEED","profile_sidebar_fill_color":"DDEEF6","profile_text_color":"333333","profile_use_background_image":true,"default_profile":true,"default_profile_image":false,"following":null,"follow_request_sent":null,"notifications":null},"geo":null,"coordinates":null,"place":null,"contributors":null,"retweet_count":0,"favorite_count":0,"entities":{"hashtags":[{"text":"thatwasntsohard","indices":[40,56]},{"text":"yesitwas","indices":[57,66]},{"text":"stoptalkingtoyourself","indices":[67,89]},{"text":"hashbrown","indices":[90,100]},{"text":"hashtag","indices":[101,109]}],"symbols":[],"urls":[],"user_mentions":[]},"favorited":false,"retweeted":false,"filter_level":"medium","lang":"en"}
For the remaining of this tutorial, we will be using 4 Python libraries json for parsing the data, pandas for data manipulation, matplotlib for creating charts, adn re for regular expressions. The json and re libraries are installed by default in Python. You should install pandas and matplotlib if you don't have them in your machine.
We will start first by uploading json and pandas using the commands below:
import json
import pandas as pd
import matplotlib.pyplot as plt
Next we will read the data in into an array that we call tweets.
tweets_data_path = '../data/twitter_data.txt'

tweets_data = []
tweets_file = open(tweets_data_path, "r")
for line in tweets_file:
    try:
        tweet = json.loads(line)
        tweets_data.append(tweet)
    except:
        continue
We can print the number of tweets using the command below. For the dataset that I prepared, the number is 71238.
print len(tweets_data)
Next, we will structure the tweets data into a pandas DataFrame to simplify the data manipulation. We will start by creating an empty DataFrame called tweets using the following command.
tweets = pd.DataFrame()
Next, we will add 3 columns to the tweets DataFrame called text, lang, and country. text column contains the tweet, lang column contains the language in which the tweet was written, and country the country from which the tweet was sent.
tweets['text'] = map(lambda tweet: tweet['text'], tweets_data)
tweets['lang'] = map(lambda tweet: tweet['lang'], tweets_data)
tweets['country'] = map(lambda tweet: tweet['place']['country'] if tweet['place'] != None else None, tweets_data)
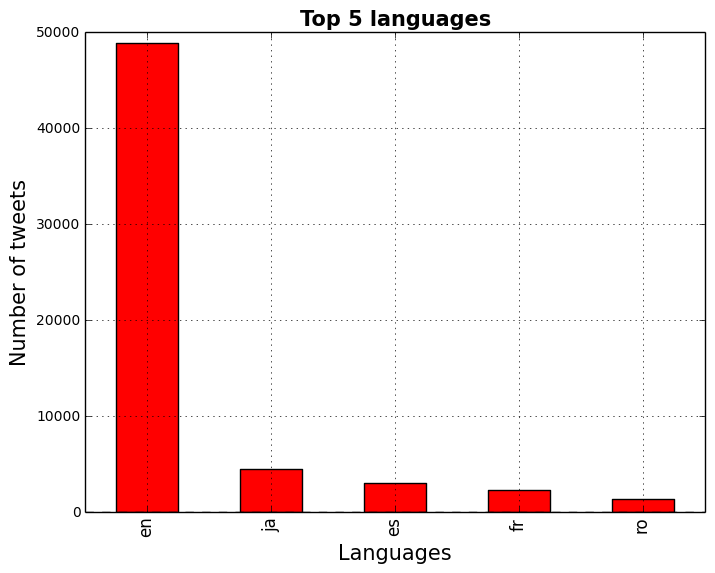
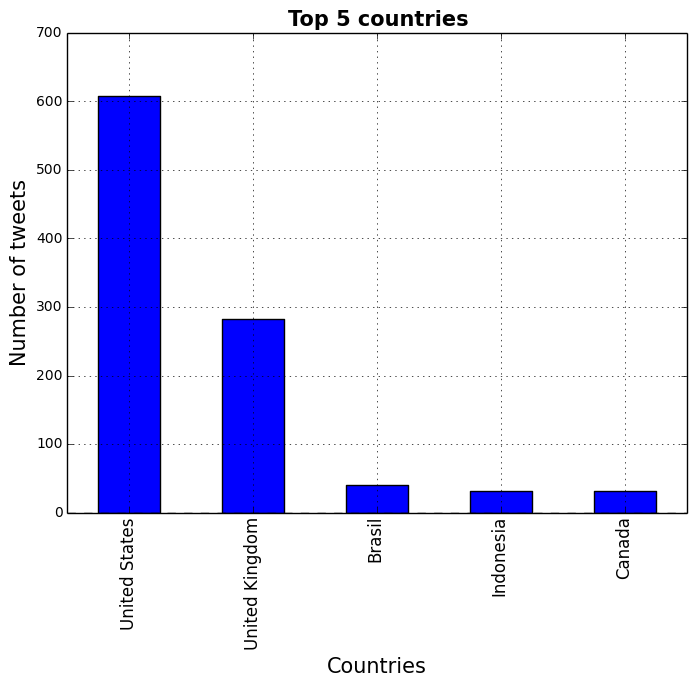
Next, we will create 2 charts: The first one describing the Top 5 languages in which the tweets were written, and the second the Top 5 countries from which the tweets were sent.
tweets_by_lang = tweets['lang'].value_counts()

fig, ax = plt.subplots()
ax.tick_params(axis='x', labelsize=15)
ax.tick_params(axis='y', labelsize=10)
ax.set_xlabel('Languages', fontsize=15)
ax.set_ylabel('Number of tweets' , fontsize=15)
ax.set_title('Top 5 languages', fontsize=15, fontweight='bold')
tweets_by_lang[:5].plot(ax=ax, kind='bar', color='red')
tweets_by_country = tweets['country'].value_counts()

fig, ax = plt.subplots()
ax.tick_params(axis='x', labelsize=15)
ax.tick_params(axis='y', labelsize=10)
ax.set_xlabel('Countries', fontsize=15)
ax.set_ylabel('Number of tweets' , fontsize=15)
ax.set_title('Top 5 countries', fontsize=15, fontweight='bold')
tweets_by_country[:5].plot(ax=ax, kind='bar', color='blue')
3. Mining the tweets
Our main goals in these text mining tasks are: compare the popularity of Python, Ruby and Javascript programming languages and to retrieve programming tutorial links. We will do this in 3 steps:
- We will add tags to our
tweetsDataFrame in order to be able to manipualte the data easily. - Target tweets that have "pogramming" or "tutorial" keywords.
- Extract links from the relevants tweets
Adding Python, Ruby, and Javascript tags
First, we will create a function that checks if a specific keyword is present in a text. We will do this by using regular expressions. Python provides a library for regular expression called re. We will start by importing this library
import re
Next we will create a function called word_in_text(word, text). This function return True if a word is found in text, otherwise it returns False.
def word_in_text(word, text):
    word = word.lower()
    text = text.lower()
    match = re.search(word, text)
    if match:
        return True
    return False
Next, we will add 3 columns to our tweets DataFrame.
tweets['python'] = tweets['text'].apply(lambda tweet: word_in_text('python', tweet))
tweets['javascript'] = tweets['text'].apply(lambda tweet: word_in_text('javascript', tweet))
tweets['ruby'] = tweets['text'].apply(lambda tweet: word_in_text('ruby', tweet))
We can calculate the number of tweets for each programming language as follows:
print tweets['python'].value_counts()[True]
print tweets['javascript'].value_counts()[True]
print tweets['ruby'].value_counts()[True]
This returns: 21839 for python, 16154 for javascript and 31410 for ruby. We can make a simple comparaison chart by executing the following:
prg_langs = ['python', 'javascript', 'ruby']
tweets_by_prg_lang = [tweets['python'].value_counts()[True], tweets['javascript'].value_counts()[True], tweets['ruby'].value_counts()[True]]

x_pos = list(range(len(prg_langs)))
width = 0.8
fig, ax = plt.subplots()
plt.bar(x_pos, tweets_by_prg_lang, width, alpha=1, color='g')

# Setting axis labels and ticks
ax.set_ylabel('Number of tweets', fontsize=15)
ax.set_title('Ranking: python vs. javascript vs. ruby (Raw data)', fontsize=10, fontweight='bold')
ax.set_xticks([p + 0.4 * width for p in x_pos])
ax.set_xticklabels(prg_langs)
plt.grid()
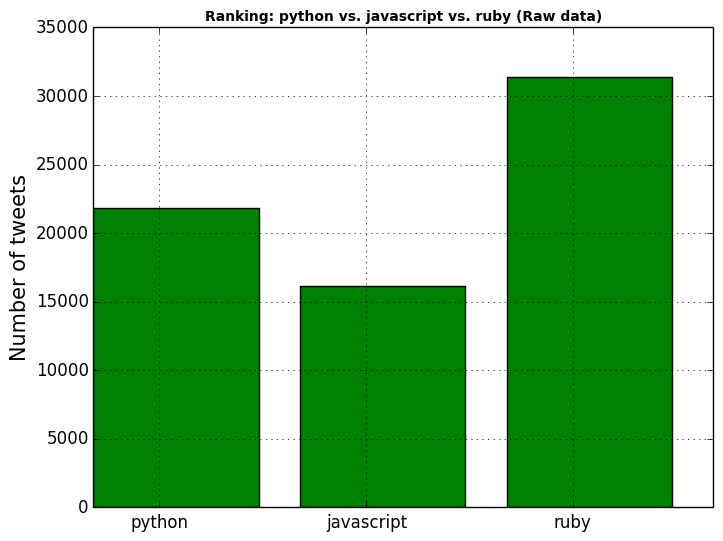
This shows, that the keyword ruby is the most popular, followed by python then javascript. However, the tweets DataFrame contains information about all tweets that contains one of the 3 keywords and doesn't restrict the information to the programming languages. For example, there are a lot tweets that contains the keyword ruby and that are related to a political scandal called Rubygate. In the next section, we will filter the tweets and re-run the analysis to make a more accurate comparison.
Targeting relevant tweets
We are intersted in targetting tweets that are related to programming languages. Such tweets often have one of the 2 keywords: "programming" or "tutorial". We will create 2 additional columns to our tweets DataFrame where we will add this information.
tweets['programming'] = tweets['text'].apply(lambda tweet: word_in_text('programming', tweet))
tweets['tutorial'] = tweets['text'].apply(lambda tweet: word_in_text('tutorial', tweet))
We will add an additional column called relevant that take value True if the tweet has either "programming" or "tutorial" keyword, otherwise it takes value False.
tweets['relevant'] = tweets['text'].apply(lambda tweet: word_in_text('programming', tweet) or word_in_text('tutorial', tweet))
We can print the counts of relevant tweet by executing the commands below.
print tweets['programming'].value_counts()[True]
print tweets['tutorial'].value_counts()[True]
print tweets['relevant'].value_counts()[True]
This returns, 871 for programming column, 511 for tutorial column, and 1356 for relevant column.
We can compare now the popularity of the programming languages by executing the commands below.
print tweets[tweets['relevant'] == True]['python'].value_counts()[True]
print tweets[tweets['relevant'] == True]['javascript'].value_counts()[True]
print tweets[tweets['relevant'] == True]['ruby'].value_counts()[True]
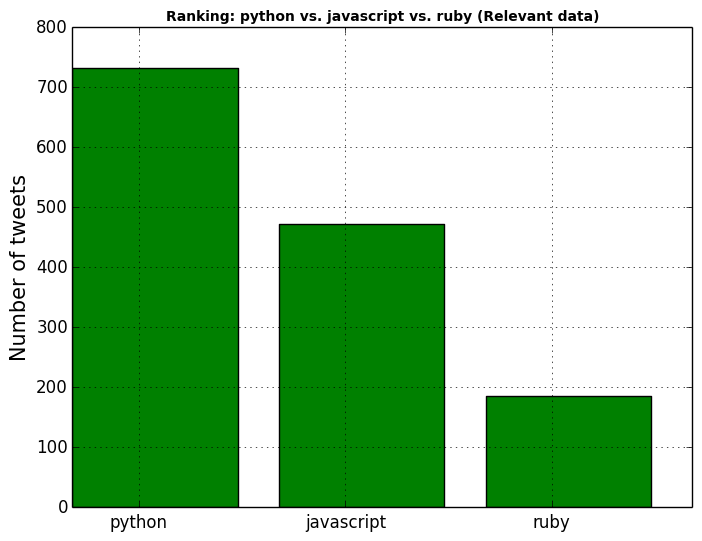
Python is the most popular with a count of 732, followed by javascript by a count of 473, and ruby by a count of 185. We can make a comparaison graph by executing the commands below:
tweets_by_prg_lang = [tweets[tweets['relevant'] == True]['python'].value_counts()[True],
                      tweets[tweets['relevant'] == True]['javascript'].value_counts()[True],
                      tweets[tweets['relevant'] == True]['ruby'].value_counts()[True]]
x_pos = list(range(len(prg_langs)))
width = 0.8
fig, ax = plt.subplots()
plt.bar(x_pos, tweets_by_prg_lang, width,alpha=1,color='g')
ax.set_ylabel('Number of tweets', fontsize=15)
ax.set_title('Ranking: python vs. javascript vs. ruby (Relevant data)', fontsize=10, fontweight='bold')
ax.set_xticks([p + 0.4 * width for p in x_pos])
ax.set_xticklabels(prg_langs)
plt.grid()
Extracting links from the relevants tweets
Now that we extracted the relevant tweets, we want to retrieve links to programming tutorials. We will start by creating a function that uses regular expressions for retrieving link that start with "http://" or "https://" from a text. This function will return the url if found, otherwise it returns an empty string.
def extract_link(text):
    regex = r'https?://[^\s<>"]+|www\.[^\s<>"]+'
    match = re.search(regex, text)
    if match:
        return match.group()
    return ''
Next, we will add a column called link to our tweets DataFrame. This column will contain the urls information.
tweets['link'] = tweets['text'].apply(lambda tweet: extract_link(tweet))
Next we will create a new DataFrame called tweets_relevant_with_link. This DataFrame is a subset of tweets DataFrame and contains all relevant tweets that have a link.
tweets_relevant = tweets[tweets['relevant'] == True]
tweets_relevant_with_link = tweets_relevant[tweets_relevant['link'] != '']
We can now print out all links for python, javascript, and ruby by executing the commands below:
print tweets_relevant_with_link[tweets_relevant_with_link['python'] == True]['link']
print tweets_relevant_with_link[tweets_relevant_with_link['javascript'] == True]['link']
print tweets_relevant_with_link[tweets_relevant_with_link['ruby'] == True]['link']
This returns 644 links for python, 413 links for javascript, and 136 for ruby. Below are some python related links
- http://t.co/WmTccp3rb1
- http://t.co/5qE3vPAy7N
- http://t.co/1rvmhqPsXD
- http://t.co/S9aq2AahjH
- http://t.co/ORg6IL8qXT
- http://t.co/EnK2UlDcJ8
- http://t.co/gtu9WVQCLK
- http://t.co/xvMTzqLGg0
- http://t.co/bgMZ0jIpA7
- http://t.co/O03VrRyEAb
- http://t.co/CfWYefZML7
- http://t.co/N3iU2ZYa2z
- http://t.co/S9aq2AahjH
- http://t.co/ytms7bcsQV
Conclusion
In this tutorial, we covered many techniques used in text mining. The code provide in this post could be modified to create a deeper analysis or could be adapted to another use case. For those who want to go further in text mining, I recommend to follow up by studying regular expressions.
You can find the source code from this tutorial in this github repository github link.
references
- http://en.wikipedia.org/wiki/Text_mining
- http://en.wikipedia.org/wiki/Word-sense_disambiguation
- http://en.wikipedia.org/wiki/Regular_expression
comments powered by Disqus