
In 1971, Thomas Schelling published a paper titled Dynamic models of segregation. The paper introduced an agent-based model that helped studying segregation in multi-ethnics cities. The model showed that a high segregation level in cities doesn't necessarily translate into intolerance at the individual level.
In this blog post, I will show how to implement Schelling's simulation using Python and a new open-source app framework called Streamlit.
In section 1, I'll introduce the case study. In section 2, I will explain how to implement Schelling's simulation using Python and Streamlit. In section 3, we will run a few simulations with different parameters and we will see how segregation at the city level doesn't necessarily translate into intolerance at the individual level.
Below is an animated gif of the application that we will build. You can find the source code in this github repository.
This post is an update of an older one that you can find here. This version contains a better implementation of Schelling simulation and an app that let us run Schelling's simulation in an interactive way.
1. The case study
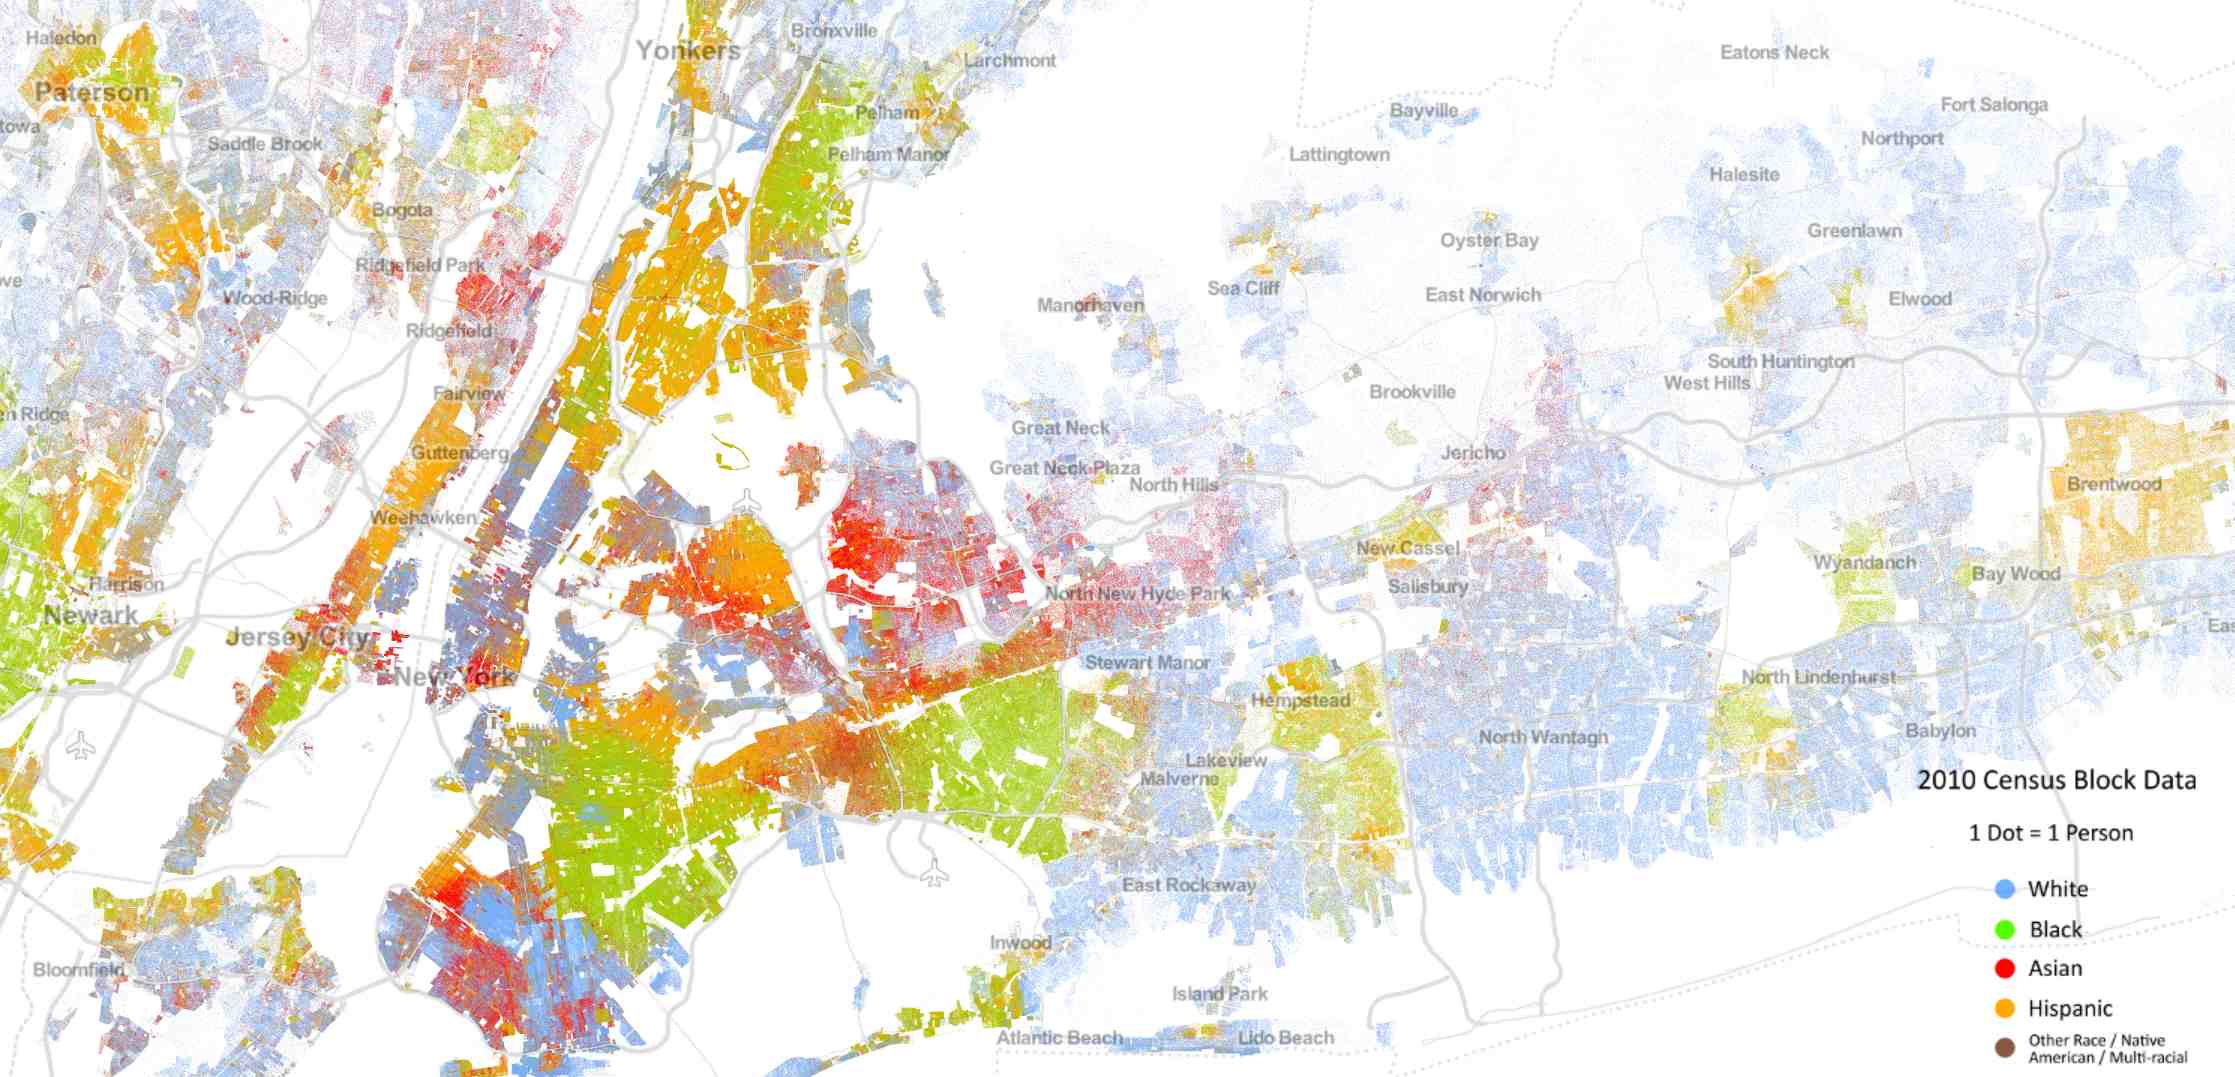
If you look at the racial distribution of multi-ethnic cities, you'll see an incredible racial segregation. For example, the New York City map below represents data from the 2010 US Census color-coded by race. You can clearly see the racial segregation.
Many would conclude from such phenomena that people are intolerant, and don't want to live next to people that are different from them. A deeper look, however, might provide some nuance. In the 70's, Thomas Schelling, the 2005 Economics Nobel Prize winner, was interested in this subject and built an agent-based model called the "Schelling segregation model" for explaining this phenomenon. With a very simple model, Schelling could show that what we see at the macro level may not in fact represent what's going down in the micro level.
 Source:
 2. Schelling Segregation Model: Setting and Definitions
In computer science, agent-based models are used to assess the effects of autonomous agents (i.e. individuals, groups or objects) on an overall system. They're very powerful analytical tools that can be used in situations where experiments aren't feasible or are very expensive to conduct. These models have a wide range of applications in the social sciences, computer science, economics and business.
Agent-based models need three parameters: 1) Agents, 2) Behavior (rules) and 3) Metrics at the aggregated level. In the Schelling model, the agents are the people living in the city, the behavior is the house moving based on the similarity ratio and the metrics at the aggregated level is the similarity ratio.
Let n be the number of races living in a city. We represent each race by a unique color and we represent the city by a grid where each cell represents a house. A house can be either empty or full. A full house can have have only one person living in it. If the house is empty, we color it in white. If the house is full, we color it by the color of the person living in it. We define the neighbors of a person to be the people living in the adjacent houses.
Schelling's goal was to test what would happen if people had a small preference that their neighbors be of the same color (or even preference for some diversity). If the ratio of neighbors of the same race is above a certain threshold (that we call Similarity Threshold), we say that the person is satisfied. If not, we say that the person is unsatisfied.
The Schelling simulation goes as follows. We start by randomly putting people in the city and we leave some houses empty. For each person living in the city, we check if he/she is satisfied. If satisfied, we don't do anything. If not, we move the person to an empty house. We run this simulation for a few iterations, and we check the final distribution of the people.
3. Implementation of Schelling's Model using Python and Streamlit
In this section, we will see how we can implement Schelling's model using Python and Streamlit. You can find the entire source code in this github repository.
We start by defining a Python class called Schelling that takes as input 4 parameters:
size: The number of houses in the city.empty_ratio: The ratio of empty houses in the city.similarity_threshold: A threshold that we will use to determine if a person is happy in his/her neighborhood. If the ratio of similar neighbors to the entire neighborhood population is lower than thesimilarity_threshold, then the person moves to an empty house.n_neighbors: The number of neighbors in each direction (top, bottom, left, right).
The constructor computes a numpy 2D array based on the size and empty_ratio parameters. We call this array: city.
class Schelling:

    def __init__(self, size, empty_ratio, similarity_threshold, n_neighbors):
        self.size = size
        self.empty_ratio = empty_ratio
        self.similarity_threshold = similarity_threshold
        self.n_neighbors = n_neighbors

        # Ratio of races (-1, 1) and empty houses (0)
        p = [(1-empty_ratio)/2, (1-empty_ratio)/2, empty_ratio]
        city_size = int(np.sqrt(self.size))**2
        self.city = np.random.choice([-1, 1, 0], size=city_size, p=p)
        self.city = np.reshape(self.city, (int(np.sqrt(city_size)), int(np.sqrt(city_size))))

    def run(self):
        ...

    def get_mean_similarity_ratio(self):
        ...
We also define 2 methods for the Schelling class:
run(): This method runs the Schelling simulation for one iteration. For each person in the city, we check if he/she's happy based on thesimilarity_ratioand thesimilarity_threshold. If the person is not happy that we move him/her to an empty house.get_mean_similarity_ratio(): This method computes the average similarity ratio of the entire city.
def run(self):
    for (row, col), value in np.ndenumerate(self.city):
        race = self.city[row, col]
        if race != 0:
            neighborhood = self.city[row-self.n_neighbors:row+self.n_neighbors, col-self.n_neighbors:col+self.n_neighbors]
            neighborhood_size = np.size(neighborhood)
            n_empty_houses = len(np.where(neighborhood == 0)[0])
            if neighborhood_size != n_empty_houses + 1:
                n_similar = len(np.where(neighborhood == race)[0]) - 1
                similarity_ratio = n_similar / (neighborhood_size - n_empty_houses - 1.)
                is_unhappy = (similarity_ratio < self.similarity_threshold)
                if is_unhappy:
                    empty_houses = list(zip(np.where(self.city == 0)[0], np.where(self.city == 0)[1]))
                    random_house = random.choice(empty_houses)
                    self.city[random_house] = race
                    self.city[row,col] = 0
def get_mean_similarity_ratio(self):
    count = 0
    similarity_ratio = 0
    for (row, col), value in np.ndenumerate(self.city):
        race = self.city[row, col]
        if race != 0:
            neighborhood = self.city[row-self.n_neighbors:row+self.n_neighbors, col-self.n_neighbors:col+self.n_neighbors]
            neighborhood_size = np.size(neighborhood)
            n_empty_houses = len(np.where(neighborhood == 0)[0])
            if neighborhood_size != n_empty_houses + 1:
                n_similar = len(np.where(neighborhood == race)[0]) - 1
                similarity_ratio += n_similar / (neighborhood_size - n_empty_houses - 1.)
                count += 1
        return similarity_ratio / count
In order to make the simulation interactive, we will use a new open-source app framework called Streamlit. Streamlit is a python library that can be installed using a pip install command. Stremlit is an easy to use library that allows us to create web applications using Python only and without writing HTML/JS/CSS code.
We start by defining the title of our app.
st.title("Schelling's Model of Segregation")
Then, we create 4 sliders that we can use to choose the parameters of Schelling simulation in an interactive way.
population_size = st.sidebar.slider("Population Size", 500, 10000, 2500)
empty_ratio = st.sidebar.slider("Empty Houses Ratio", 0., 1., .2)
similarity_threshold = st.sidebar.slider("Similarity Threshold", 0., 1., .4)
n_iterations = st.sidebar.number_input("Number of Iterations", 50)
We then create a Schelling instance and we calculate the average similarity ratio a the beginning of the simulation.
schelling = Schelling(population_size, empty_ratio, similarity_threshold, 3)
mean_similarity_ratio = []
mean_similarity_ratio.append(schelling.get_mean_similarity_ratio())
We then plot the city and an empty graph that will show the average similarity ratio for each iteration of the simulation.
#Plot the graphs at initial stage
plt.style.use("ggplot")
plt.figure(figsize=(8, 4))

# Left hand side graph with Schelling simulation plot
cmap = ListedColormap(['red', 'white', 'royalblue'])
plt.subplot(121)
plt.axis('off')
plt.pcolor(schelling.city, cmap=cmap, edgecolors='w', linewidths=1)

# Right hand side graph with Mean Similarity Ratio graph
plt.subplot(122)
plt.xlabel("Iterations")
plt.xlim([0, n_iterations])
plt.ylim([0.4, 1])
plt.title("Mean Similarity Ratio", fontsize=15)
plt.text(1, 0.95, "Similarity Ratio: %.4f" % schelling.get_mean_similarity_ratio(), fontsize=10)

city_plot = st.pyplot(plt)
The following line allows to add a progress bar to our simulation.
progress_bar = st.progress(0)
Finally, we define a streamlit button that once pushed, will run the simulation for n_iterations times.
if st.sidebar.button('Run Simulation'):

    for i in range(n_iterations):
        schelling.run()
        mean_similarity_ratio.append(schelling.get_mean_similarity_ratio())
        plt.figure(figsize=(8, 4))

        plt.subplot(121)
        plt.axis('off')
        plt.pcolor(schelling.city, cmap=cmap, edgecolors='w', linewidths=1)

        plt.subplot(122)
        plt.xlabel("Iterations")
        plt.xlim([0, n_iterations])
        plt.ylim([0.4, 1])
        plt.title("Mean Similarity Ratio", fontsize=15)
        plt.plot(range(1, len(mean_similarity_ratio)+1), mean_similarity_ratio)
        plt.text(1, 0.95, "Similarity Ratio: %.4f" % schelling.get_mean_similarity_ratio(), fontsize=10)

        city_plot.pyplot(plt)
        plt.close("all")
        progress_bar.progress((i+1.)/n_iterations)
In order to run the app, we just have to write the following command in a terminal.
streamlit run app.py
From a browser, we go to http://localhost:8501 to see the app.
4. Simulations
Now that we have our streamlit app ready, we can run our Schelling simulations. In the 3 simulations below, we changed the similarity threshold and we run the simulations for 10 iterations.
From these simulations, we can see that:
- The higher the similarity threshold, the higher the level of segregation in the city.
- Even with a relatively low similarity threshold (40%), we end up with a high segregation level (over 85%).
5. Conclusion
In this blog post, we saw how to implement Schelling segregation model in Python and Streamlit. This very simple model helped us understand a very complex phenomena, namely segregation in multi-ethnics cities. We could show that a very high segregation level in cities doesn't necessarily translate into intolerance at the individual level. We also saw the power of Streamlit that allowed us to build a powerful interactive web application using Python only.
References
- Thomas Schelling, Dynamic models of segregation
- An Introduction to Agent-based Models: Simulating Segregation with Python
comments powered by Disqus